Bitcoin Elasticity and Volatility
So the crypto markets on May 19th were fun!? If you have been a part of these markets for any time, this volatility is not that surprising. That said it is still pretty amazing that the price can drop 30% in a single day. This is maybe more surprising since it is to the backdrop of an increase in institutional investors and a narrative of “this time it’s different”. I was asked a question with regards to “how is this level of volatility is possible?” I suspect that it is a problem related to some idiosyncrasies of crypto exchanges and the limited free float. I was curious to see what the data said and specifically what the market did during the massive pin bar that touched the 30k USD level.
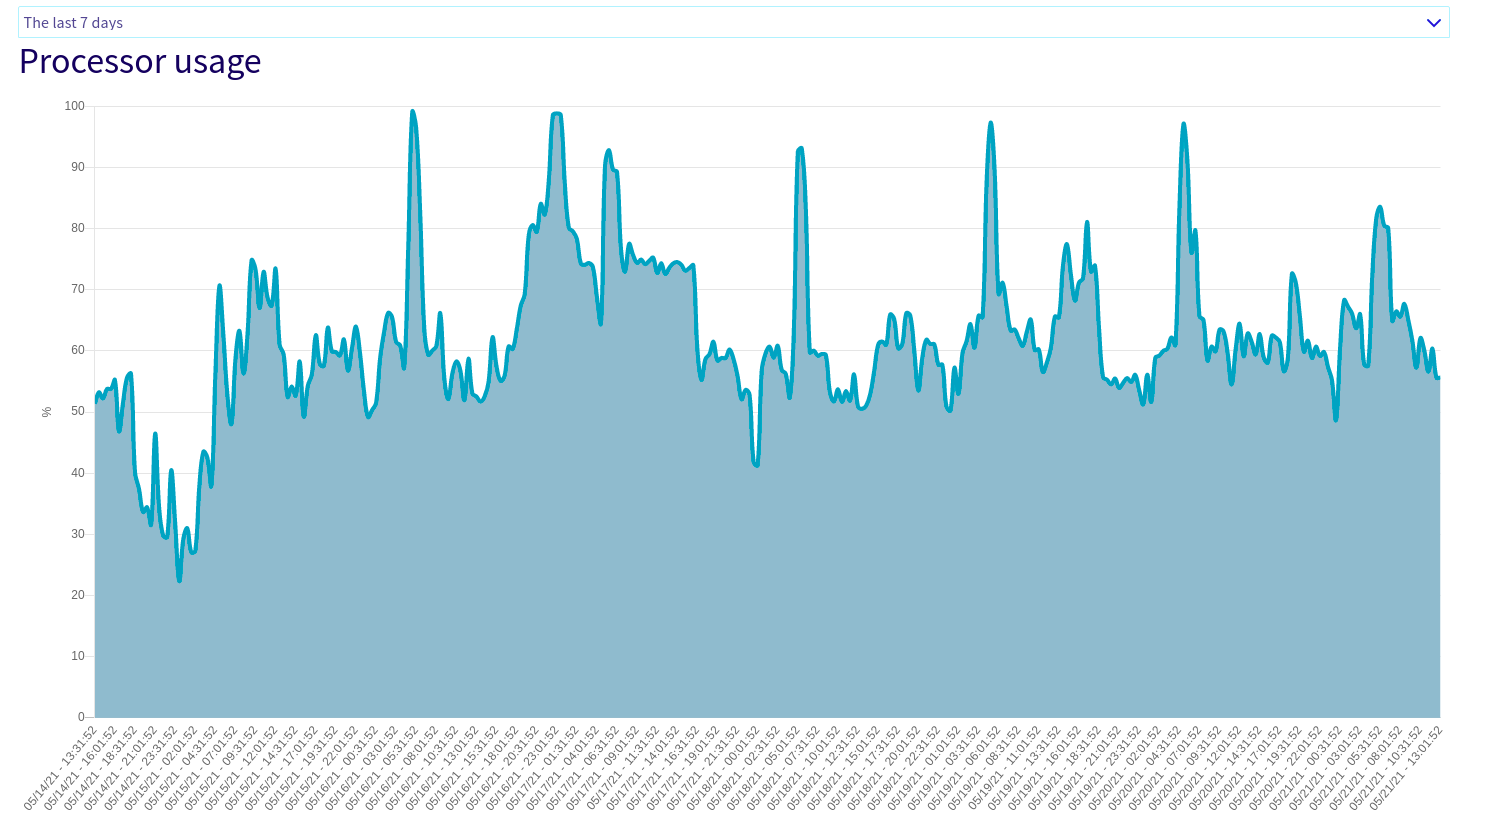
Thankfully about a week ago I managed to complete a Rust market data collector for binance that lets me collect order book and trade data. This collector is much better than my previous python implementation since the old one often was overwhelmed when there was a large spike in the volume of market data. This led to the collected data having clock drift in timestamps since it was not possible to process the WebSocket feed fast enough. Rust is a monster and has no such issues as can be seen by the cpu load over the last 7 days.
python cpu 7-day load
rust cpu 7-day load
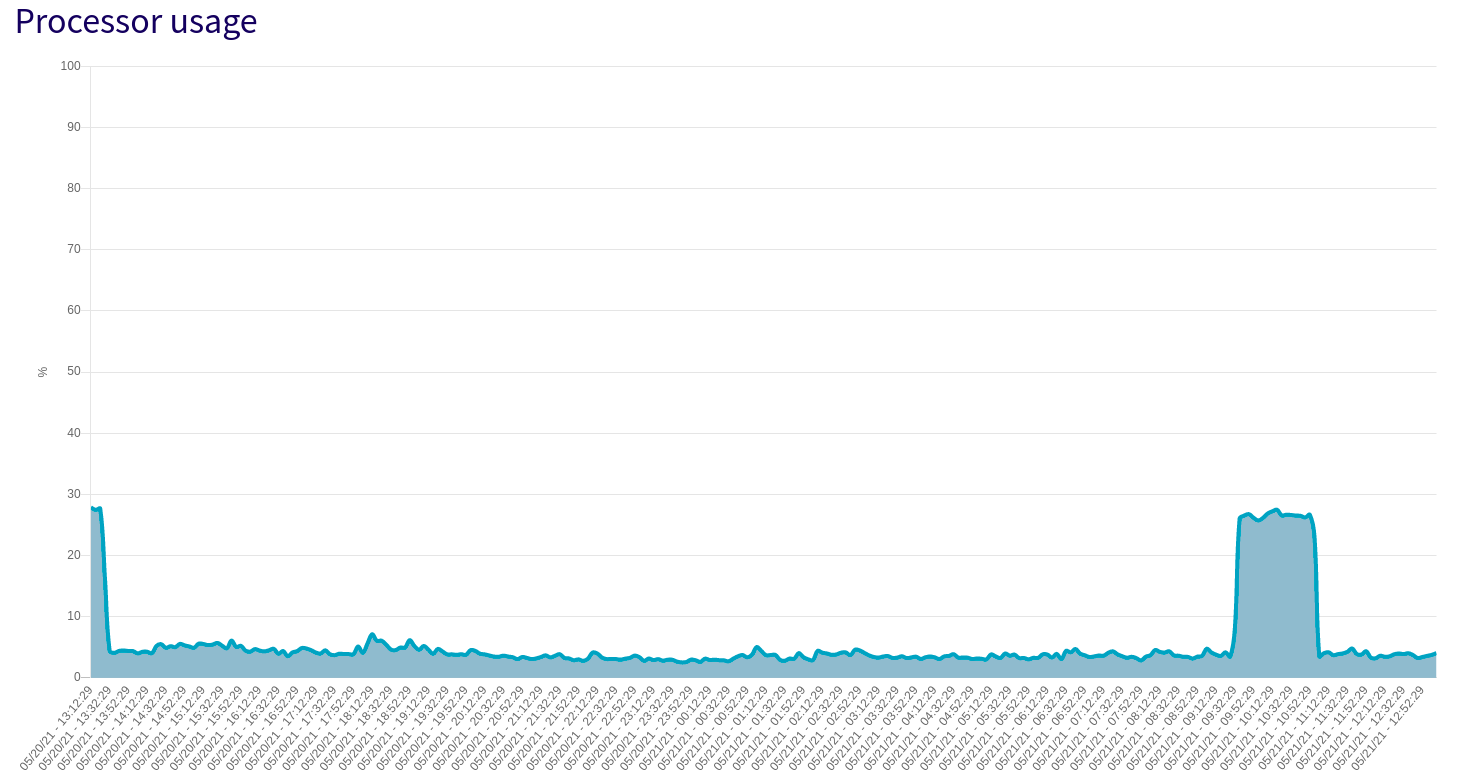
I think the spikes on the rust machine are from running gzip and moving data off the machine.
The Hypothesis
Since there is a limited amount of margin on each exchange at any one time this means the free float of cryptos are relatively low. I hypothesise that due to liquidations and issues with margin, prices become overly elastic and move on relatively low volume imbalances. An amount of volume which would normally move the market 1k could thus push the market 10k.
The Indicator
To measure order flow imbalance I use an event time indicator like Tr8dr’s BSI indicator described here. The indicator is the decaying cumulative sum of the signed volume. The labelling of the trades is something for debate. The binance “market maker is buyer” flag gives suspicious results, so I have discarded it in favour for using the price relative to mid.
pub struct BSIEma {
    pub value:f64,

    last_update_time:u64,
    alpha:f64,
}

impl BSIEma {

    pub fn new(half_life: u64) -> Self {
        BSIEma {
            value: 0.0,
            last_update_time:0,
            alpha: 2.0f64.powf(-1.0/(half_life as f64)),
        }
    }

    pub fn update(&mut self, ts: u64, qty: f64) -> f64 {

        // calculate the decay based on time passage
        let mut dt:f64 = (ts - self.last_update_time) as f64;
        let decay = self.alpha.powf(dt);
        self.last_update_time = ts;

        // decay existing values
        self.value *= decay;

        // update with new data
        self.value += qty;

        return self.value;
    }
}
Results
BTC Price vs 60 second BSI
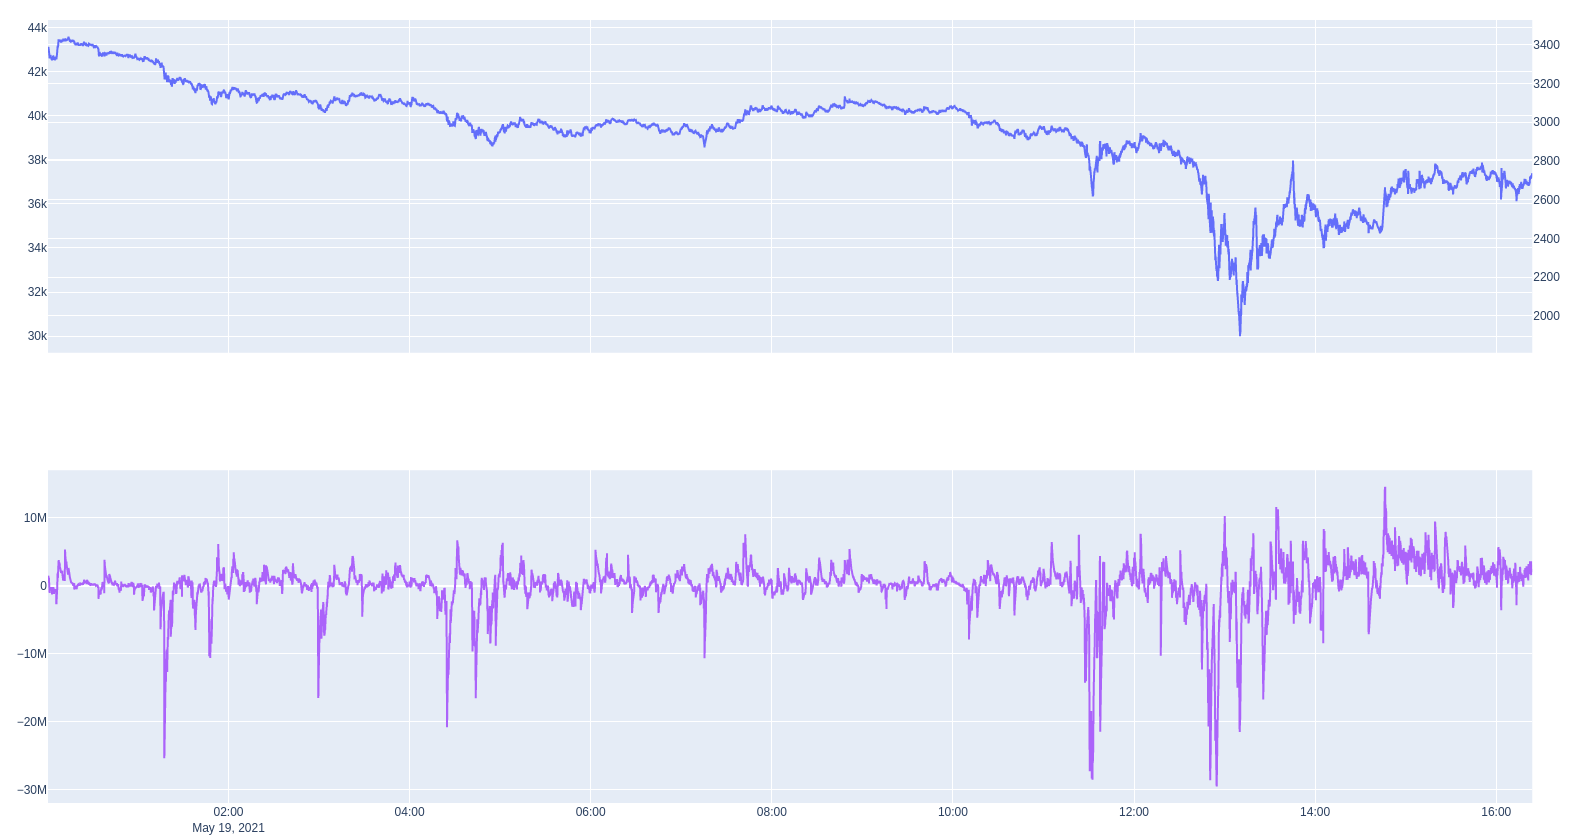
During the day there were about 5-6 large sell events where the 60-second buy/sell imbalance exceeded 20 million USD. Interesting the first at about 1 am UTC only moved the market 1k USD. 20M USD at a price of 40k USD is equivalent to about 500 BTC or 0.002671888% of the total (assuming 18,713,356.25) in the world. I am surprised by these numbers since I expected them to be higher given the level of bloodshed in the market.
Zoom In Of Large Market Drop
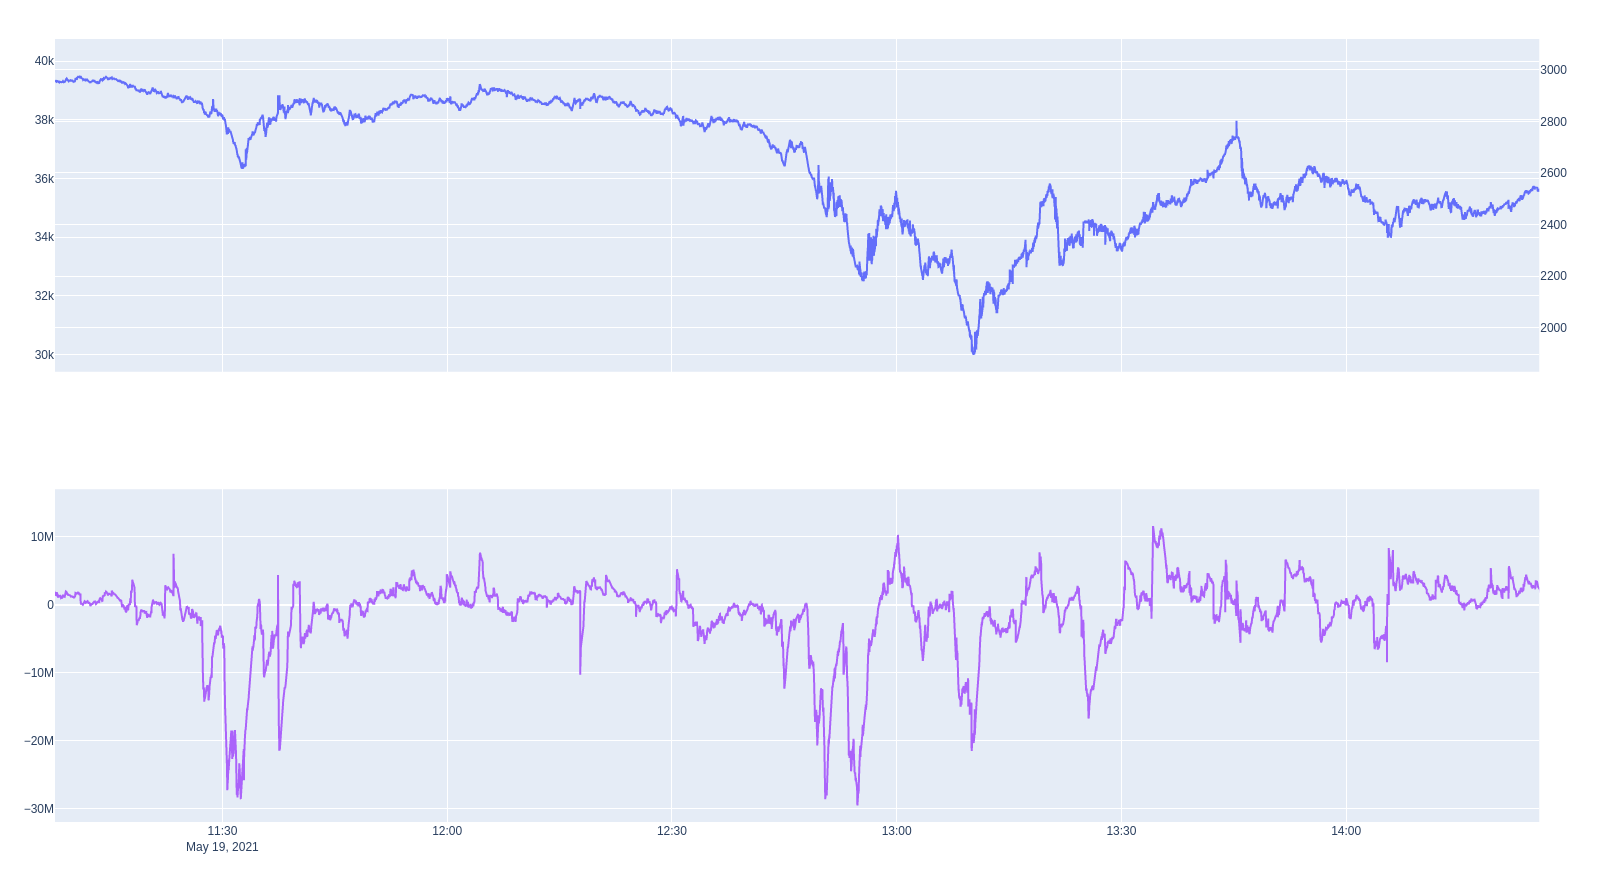
During the times when the market moved down to 30k, there were three individual events each with a 60 second BSI imbalance of about 20M. The first two sell events moved the price about 3k together, and the final moved the price 3k USD on its own. During the whole day, the elasticity of the market was increasing meaning the amount of volume it took to move the market was much lower.
Conclusion
There is more formal analysis to do relating to a dynamic relationship between liquidity and volatility. That was not the aim of this post. I mainly wanted to show how significant the change in the markets’ ability to clear volume imbalances became on May 19th.
It would be better if I could include data from the whole aggregate market but at the moment I only have clean data for one exchange.
The price of assets when there is limited free float can be complicated. When there is a large amount of the asset off-exchange and held by people then price discovery can be difficult. There is in essence a “complete” limit order book in which all holder of the asset would be willing to move the assets to exchange given a certain price. However, these orders are invisible. I doubt the majority of holders are moving BTC on exchange to sell at these current prices, so the exchange order book data is in essence incomplete. This is why the on-chain analysis data is so compelling as it gives an insight into this wider “complete” order book.
To summarise bitcoin is an odd asset due to some nuances of its decentralised nature, lack of prime brokerage and the decentralised exchanges on which it transacts. It is volatile however its volatility is exacerbated by the inability to see the complete market which is where buyers and sellers would be willing to transact their whole holding as opposed to the thin slice they have on exchange.
This is not investment advice. Cryptos are highly risky assets.
Note
I noticed recently that this blog had been added to Quantocracy. It’s nice to see people reading my ramblings and it has motivated me to write more. To those of you who have written directly to me. Thank you, your questions are really helpful, both to clarify ideas of mine and also to think about topics to post about.