GANs and Synthetic Market Data
I have been thinking a lot about risk lately. The liquidity injections from the FED are pushing risk assets higher and higher. There seem to be bubbles in nearly every speculative assets. The main concern long term would be rising rates at the same time as a falling dollar suggesting there is no longer a market for US debt. Recently however rates have been rising which is causing concern that the risk asset bubble might burst under the pressure of higher rates. There has been a lot of concern regarding a possible disorderly exit from risk assets into the dollar since at these levels that would lead to a situation like in March 2020 where the price of almost everything dropped together. This is a difficult situation to hedge since when there is comprehensive liquidation to dollars correlations tend to one, making most hedges fail. The question is how to model these events, and also how to design hedging strategies that can detect and cope with such a scenario.
Synthetic Data
There are a couple of issues with market data that need addressing. Opportunity is highly clustered in time and also we are only able to see one path from the possible price distributions. If there was a way to create multi-variate data that had the same stylistic properties of the underlying price distribution it might be possible to build strategies that are less prone to overfitting.
GANs
There are a group of deep learning models called general adversarial networks (GAN) that can produce some amazing realistic synthetic images. Given a set of images of real faces, they can generate synthetic faces which do not exist, and yet they look very realistic. The way this is done is by having two separate networks, one a generator, the other is a discriminator. The discriminator is used to determine if the generator is working correctly. By training the two networks together its possible to train the combined model to do a better job than just training one network alone.
Time-series Signatures
The issue with generating time series is how to define what a realistic time series looks like. This is where the concept of time series signatures are useful. The Signature of a time series is a universal description for a stream of data derived from the theory of controlled differential equations.
Code
The following github code is an implementation of this paper. The code is an implementation of a time series signature GAN for modelling multivariate time-series. The discriminator uses the signature of the training set to determine if the generated time series is realistic.
Example
The Conditional-Sig-Wasserstein-GAN code can model various time series simultaneously. It can model volumes along with prices and preserve the co-dependence relationship. Large price moves correspond to large volume spikes this correlation can be replicated in the simulated data. When simulating with multiple price series it does an excellent job of preserving the changing correlations during a crash.
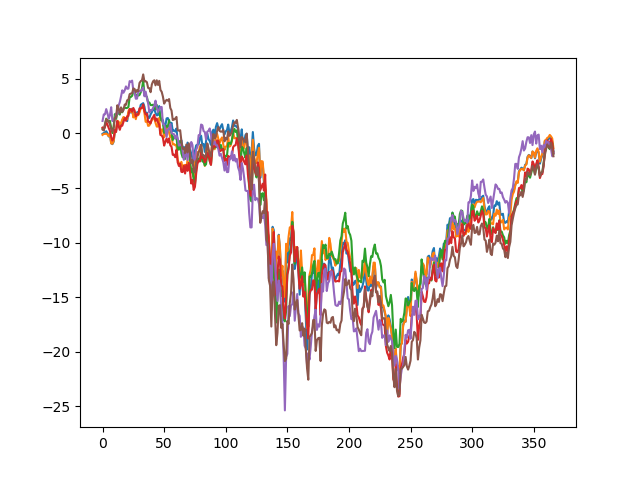
The Cond-Sig-Wass-GAN model was fitted to a years worth of global stock indices (SPX, DJI, FTSE, STOXX50E, HSI, AEX) prices during the 2008 crash.
The training data of the 2008 crash:
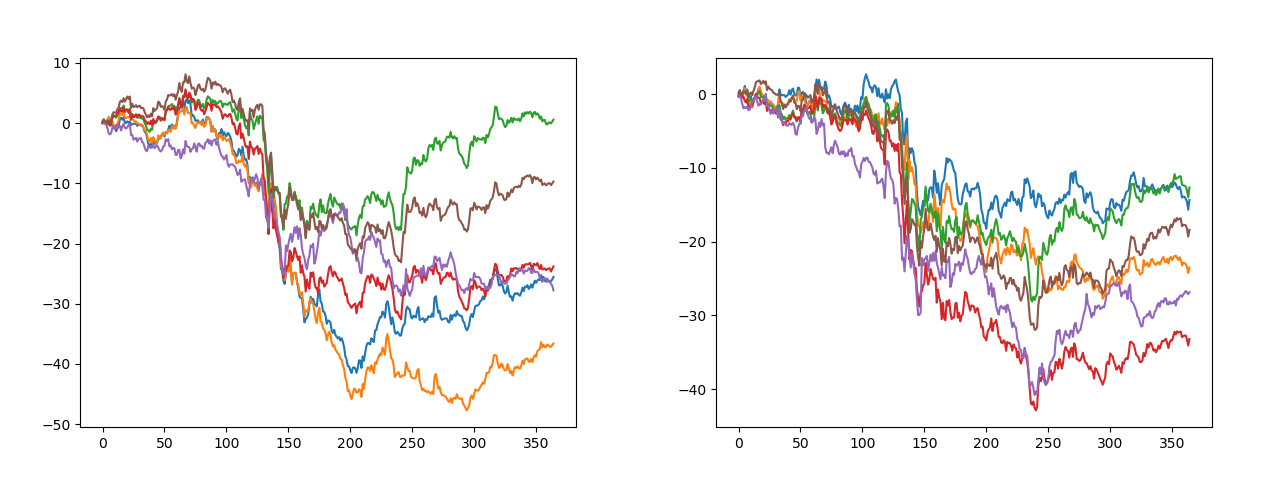
Once the model was fitted, the generated price paths look like
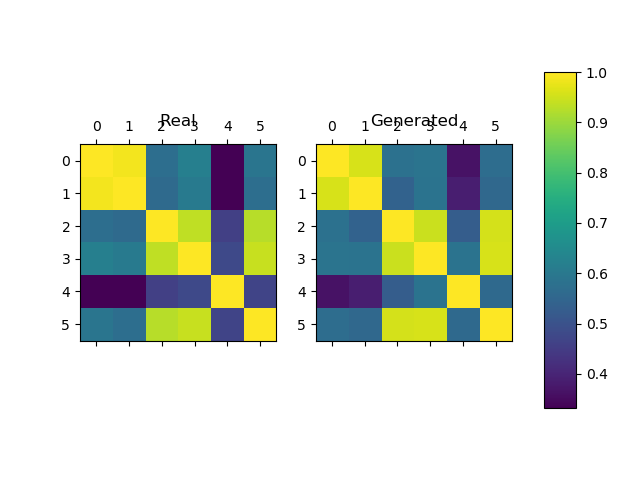
The simulated data seems to preserve the correlation structure of the data well.
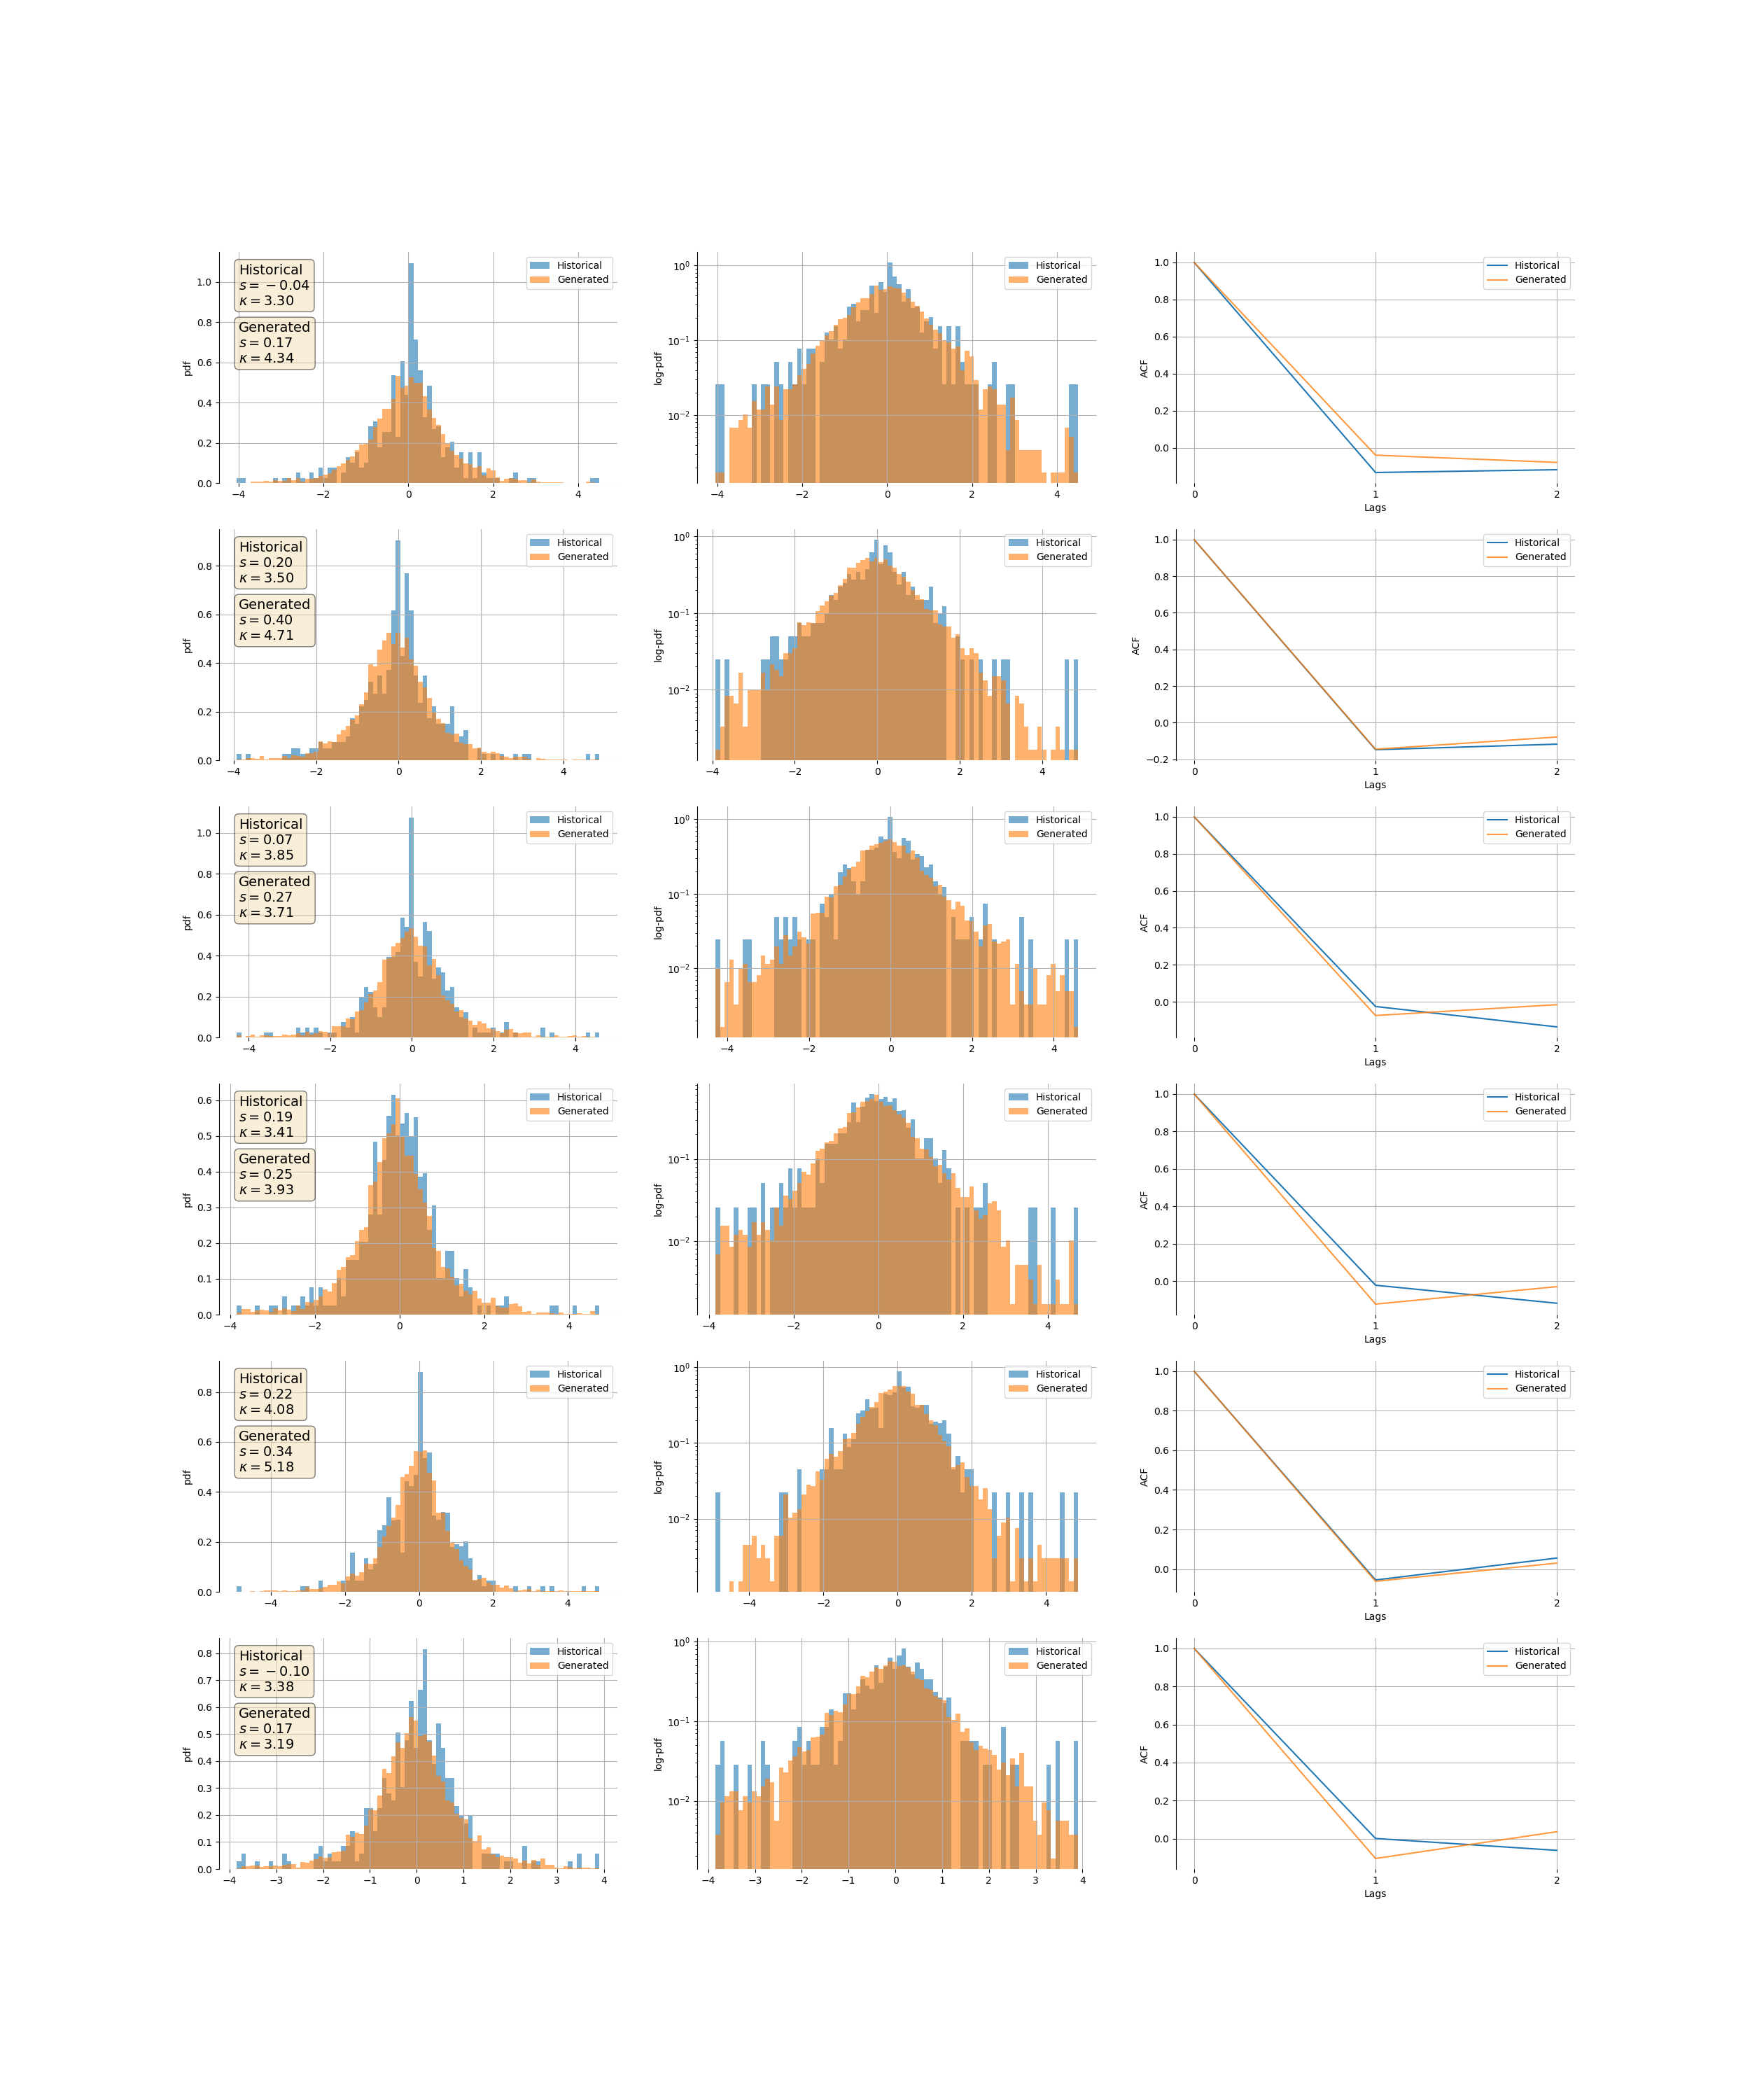
The summary of real and simulated distributions shows that the simulated data also shows high levels of kurtosis.
Conclusion
The Conditional-Sig-Wasserstein-GANs does a decent job but it is not perfect. The generated price paths seem to diverge more than the real data. It seems that if there is a strong co-integration relationship this seems to be lost over time. It is however still quite impressive how well the technique works. I wonder if a hedging strategy was to be fitting using this simulated data if it would help with overfitting or just lead to the strategy learning features that do not really exist.
Further reading
I will add a post at some point about copulas which is another method to capture non-linear correlation trends in financial assets. Certain copulas can model asymmetric tail dependence which is hard to model using other means.