Paper vs Live Slippage Analysis
I recently went live with a crypto mean reversion strategy on BYBIT. The reason for choosing to test the strategy on this exchange is mainly that they offer rebate fees of -0.025% if you are a market maker. This is much more attractive than the fees on many other exchanges. BYBIT in my experience is pretty much a carbon copy of BITMEX and seems to have a very stable API. BITMEX has its issues regarding becoming unresponsive in times of high volumes but for the most part, their technology is useable. I have a good amount of experience of algo trading on crypto exchanges and there are practical issues with strategy implementation on these exchanges relating to both their performance as well as the design of each exchange’s API. BYBIT and BITMEX for all their issues are in my favourite exchanges due to their fee models their API.
Strategy
I recently completed testing on a new strategy. It is a medium frequency outright strategy that takes positions on various cryptocurrencies and bets on their reversion. From simulation, the equity chart looks like this.
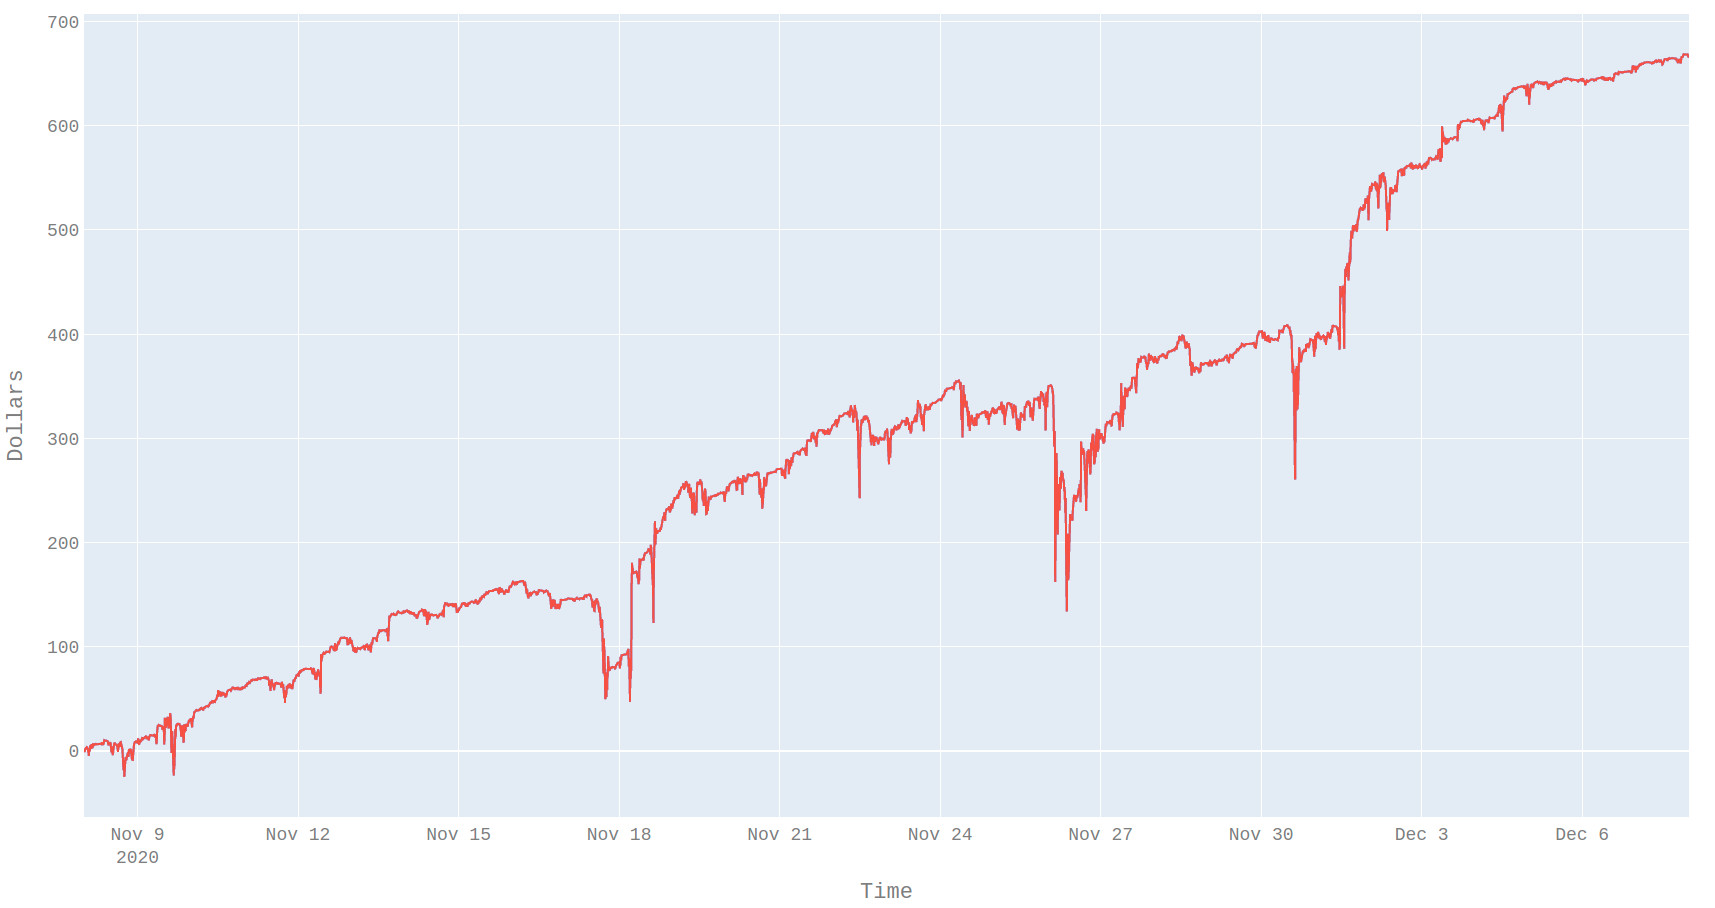
There are some important points to note.
- Simulation execution assumes to buy we join the best bid and are filled when the ask crosses the bid.
- The goal of the live trading exercise is mainly to validate the simulations rather than strategy optimisation.
- Simulation round trip pnl is 0.1% which should be enough to ensure live trading is not too risky even if slippage is higher than expected.
My assumption is that the strategy is profitable and the \(\alpha\) is time stable. My main concern is that due to the strategy using passive execution, slippage is high thus invalidating the simulated result. Correcting the simulation for slippage is not as simple as just adding a penalty since slippage is often correlated to the trades that do the best since these fills are competitive. Imagine seeing a PS5 online for $300, is that stock likely to be available for long? This is one of the drawbacks to averages. The average slippage might be small but if the pnl is concentrated in a few trades then a large slippage on those trades with disproportionately affect the live results. This is an effect that will need to be explicitly checked for.
If the simulator is properly encapsulated then it is easy to run it alongside production but swapping the historic price feed with a live price feed. The backtesting software must be designed to achieve this with minimal changes. Even with just changes to a live vs historic feed, I would expect differences in the simulation and paper results. There a couple of reasons for this.
- Problem 1
- The forecast takes about 200 ms to calculate on a new bar thus the in paper and live the orders are sent later than in sim.
- We can estimate the computation time for the forecast and delay the orders by this much in sim.
- Problem 2
- Crypto exchanges do not have sequence ids on their feeds and in my experience of running multiple feeds via rest it seems that the data in two feeds is different.
- We could record the market data on the live machine and use this at a later date with simulation. The main reason I don’t do this is that I don’t want to overload production trading with having to also do a massive amount of IO.
- Problem 3
- Live and paper are heavily multi-threaded whereas sim is single-threaded. In the initial runs, there were issues with race conditions leading to paper trading different to live.
- Using locks ensures the discrete decision set between sim and paper are the same irrespective of the environment.
I should note my aim is not to get a perfect simulator as this task takes a lot of effort and I would like to focus on strategy optimisation as much as possible given time constraints. Also, it should be noted the main reason for choosing to focus on trading medium frequency strategies was so that I can minimise the impact of execution since it’s notoriously difficult to simulate with passive strategies. This however does not mean execution can be ignored completely.
Deployment
The deployment of the different environments is shown.
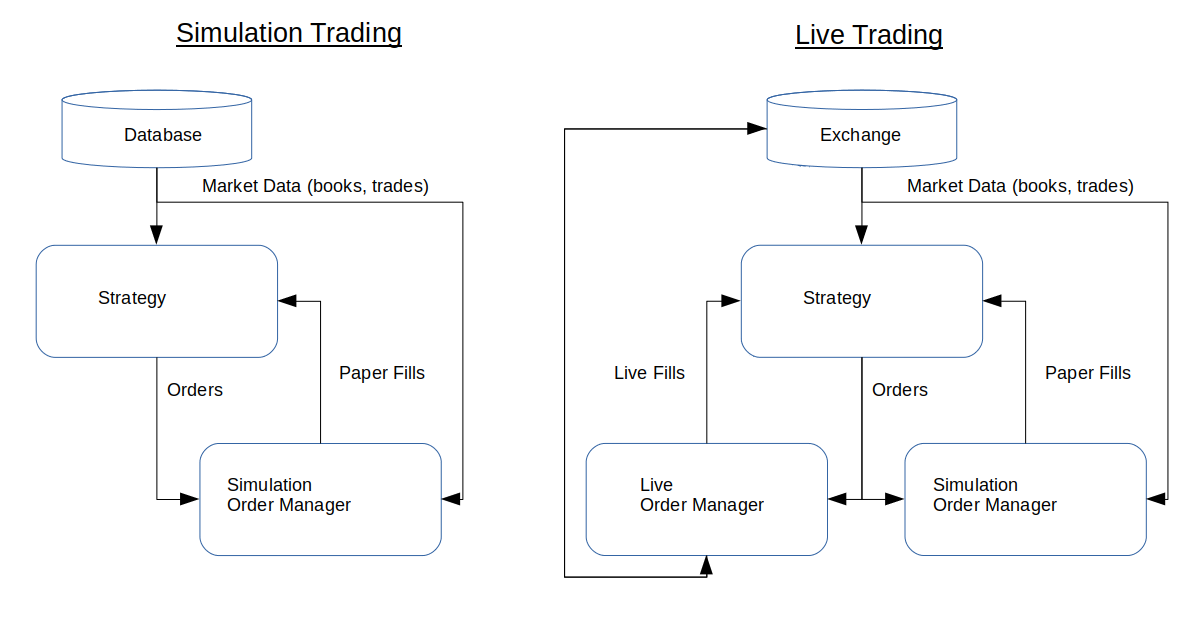
This gives us three estimates of the performance of the strategy simulation, paper and live.
By assuming that the returns of the strategy are time stable we can assume:
\[\alpha_t = \alpha \hspace{1cm} \forall t\]What we would like to test from the results is
\[pnl_{sim} = \alpha dt + \sigma dW^{sim}\] \[pnl_{prod} = \alpha dt + \sigma dW^{prod}\]It is easy in simulation to test the null hypothesis \(\alpha = 0\) what we would like to know is if \(alpha_{sim} = alpha_{prod}\) since if \(alpha_{sim} = alpha_{prod}\) and \(alpha_{sim} > 0 \implies alpha_{prod} > 0\). If the execution is the same between simulation and production then this should be the case. At that point, the only concern is the time stability of alpha. What is mean but this is to make sure that just because we have historically made money doesn’t mean that we will make money in the future. This is a different topic that many books (deprado, masters) have been written about and something I plan to post more about at a later date.
Results
| Environment | Buy Count | Buy Qty | Avg Sell Price | Sell Count | Sell Qty | Avg Buy Price |
|---|---|---|---|---|---|---|
| Sim | 23 | 3726 | $18218.10 | 28 | 4115 | $18202.61 |
| Live | 23 | 3726 | $18220.39 | 28 | 4115 | $18204.24 |
| $ 2.29 | $-1.63 |
The volume-weighted slippage is around 0.000557 % which is a lot lower than I was expecting and is even positive.
Positive slippage means that live outperformed paper. This is not that surprising given the fact the simulation only fills orders by the market price crossing it. In reality, orders can be filled at a better price in a wider market by being aggressed without the bid-offer price changing. The current implementation is designed to be fast and simple. I mainly wanted to make sure slippage was no worse than the BYBIT rebate of 0.025% and no worse than simulation profit per trade of 0.1%
Given the current data set it looks like the per trade profitability of 0.08867% is about what simulation predicted at 0.1%. To truly validate the strategy, it still needs to trade for longer and also during times of serious market stress. That aside the current results are promising and good enough to warrant continued live testing.
Note
In my opinion, it’s better to go live with a model as soon as possible. It is easy to spend a huge amount of time perfecting a model in sim, adding parameters and finding solutions to edge conditions only to find when its traded live it does not make money. There are various reason for this related to data quality, simulated execution assumptions, latency, exchange outages etc. The sooner it is possible to get live results and to validate simulations the better. Doing this massively increases the future confidence in any pnl improvement from optimisations.