The Problem with Moving Averages
Moving averages are so prolific that even price action traders (a notoriously anti indicator group) often include a single moving average. Many other indicators such as MACDs use moving averages and moving averages of differences in moving averages. Even with its extensive usage, there is one major drawback to moving averages which is they lag the data. Even though lag is a commonly known issue there is little discussion of how much lag there is, it’s implications and how it can be compensated for.
There are 3 types of common moving averages used in trading software.
- Simple moving averages (SMA)
- Weighted moving averages (WMA)
- Exponential moving averages (EMA)
The first two are forms of fixed impulse response (FIR) filter. An FIR is a filter in which the weights associated with each past observation are finite. In the case of a 4 SMA, the weights are simply [0.25, 0.25, 0.25, 0.25]the moving average is then just price most recent sum(prices * weights). The SMA is a special case of the WMA in that the weights are uniform. The ema is a form of infinite impulse response (IIR) filter meaning there is not a fixed number of weights, so the time dependence on the past is infinite although old observations have infinitesimal weights.
Issue
The main criticism of moving averages is that they are lagged meaning you are not observing the current average but that of old lagged data. This is a particular problem with moving average cross over strategies since the amount of lag is a function of the weights. Since an SMA is a form of FIR filter this makes computing the amount of lag simple. The lag is calculated as the point at which 50% of the weight of the filter is held. This also explains why EMAs are said to have less lag than SMAs since a larger proportion of the weight is closer to the most recent observation. In the case of the 4 SMA, the lag is 2 steps. This is much easier to see in visual form.
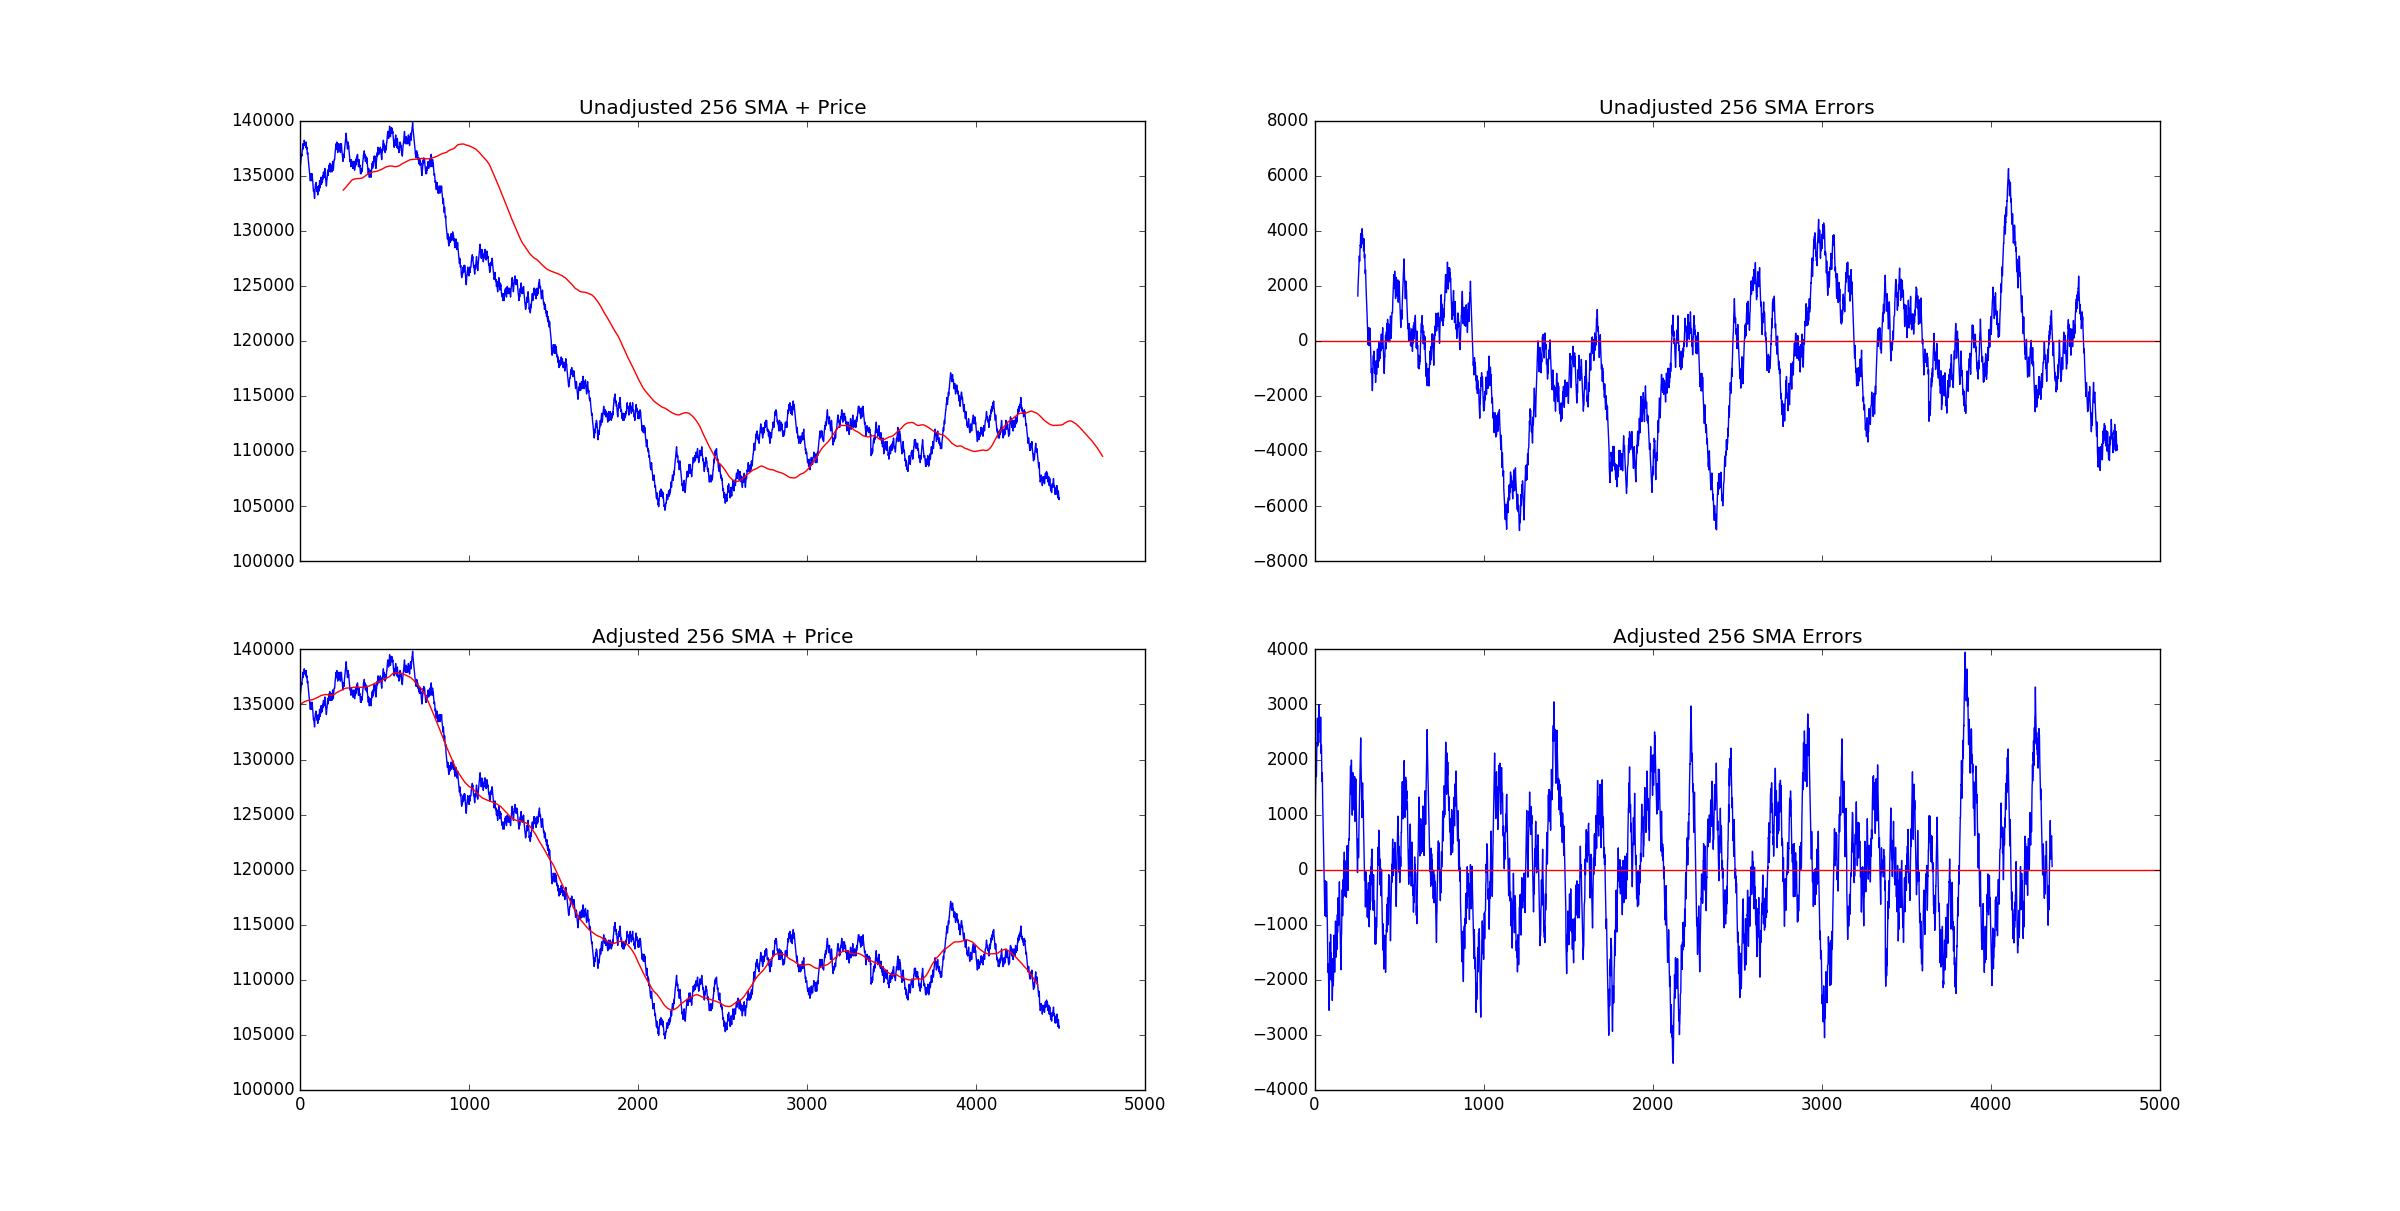
The top left chart is the standard SMA you would expect to see in tradeview or meta trader. The bottom left chart is the same 256 SMA shifted back 128 steps. It’s possible to see the moving average is a perfect fit for the data. The two right plots are the residuals of the price and the moving average. It can be seen that the bottom right plot is far more stationary which has positive benefits when trading.
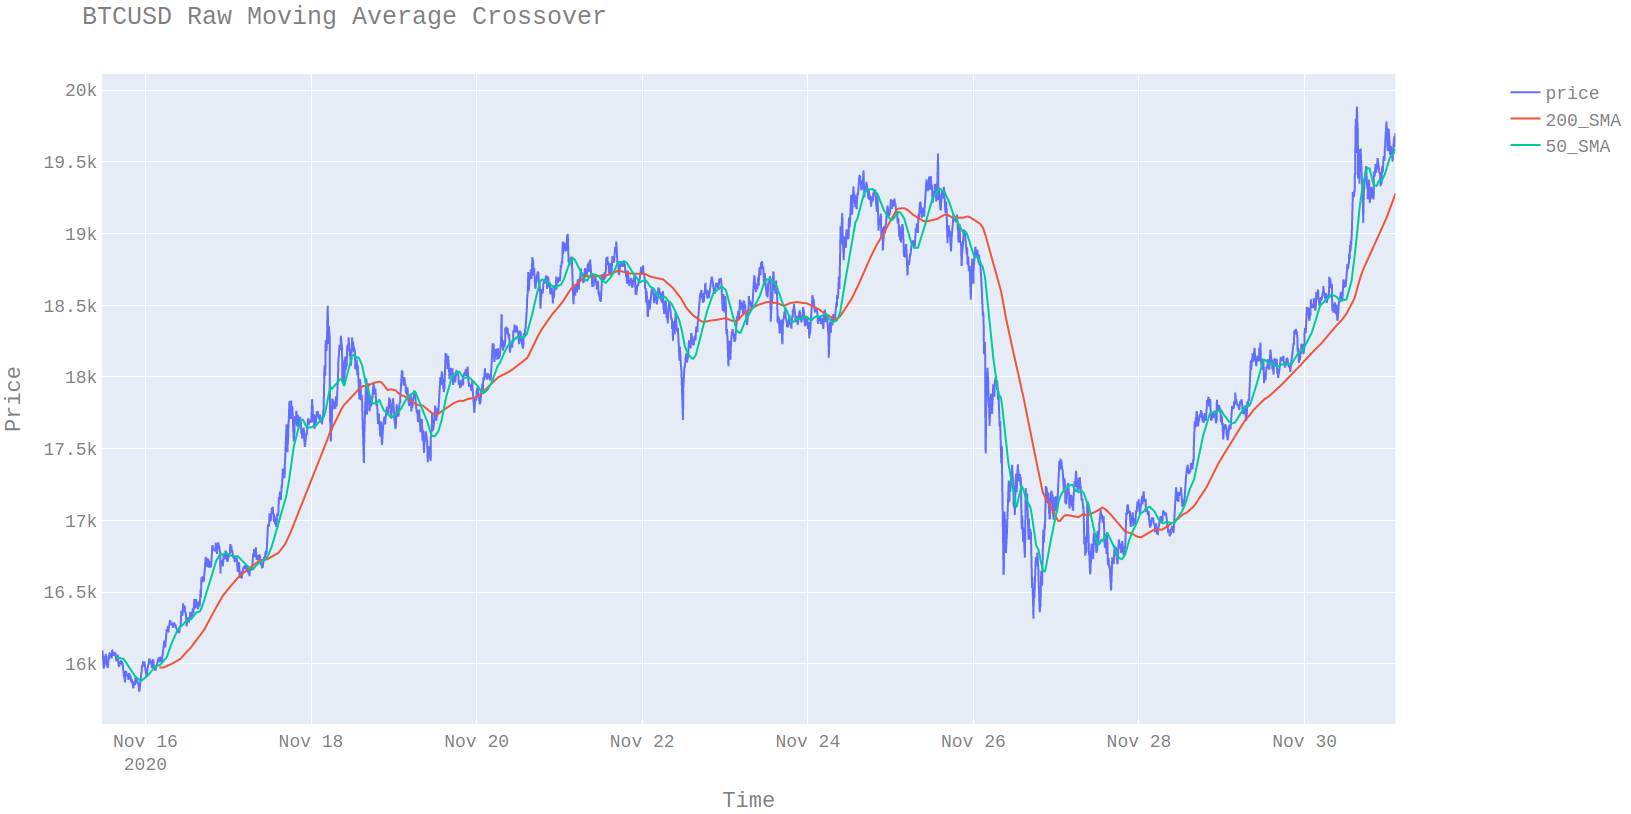
The reason this is important in the case of cross over strategies is that the lag between a 200 SMA and a 50 SMA is different. What should be compared it the shifted version since these are actually “in phase”. The issue is the missing data means that by the time they cross over is confirmed the trader is likely too late. There are various zero lag moving averages that try to compensate for this issue but I will leave those for a different post.
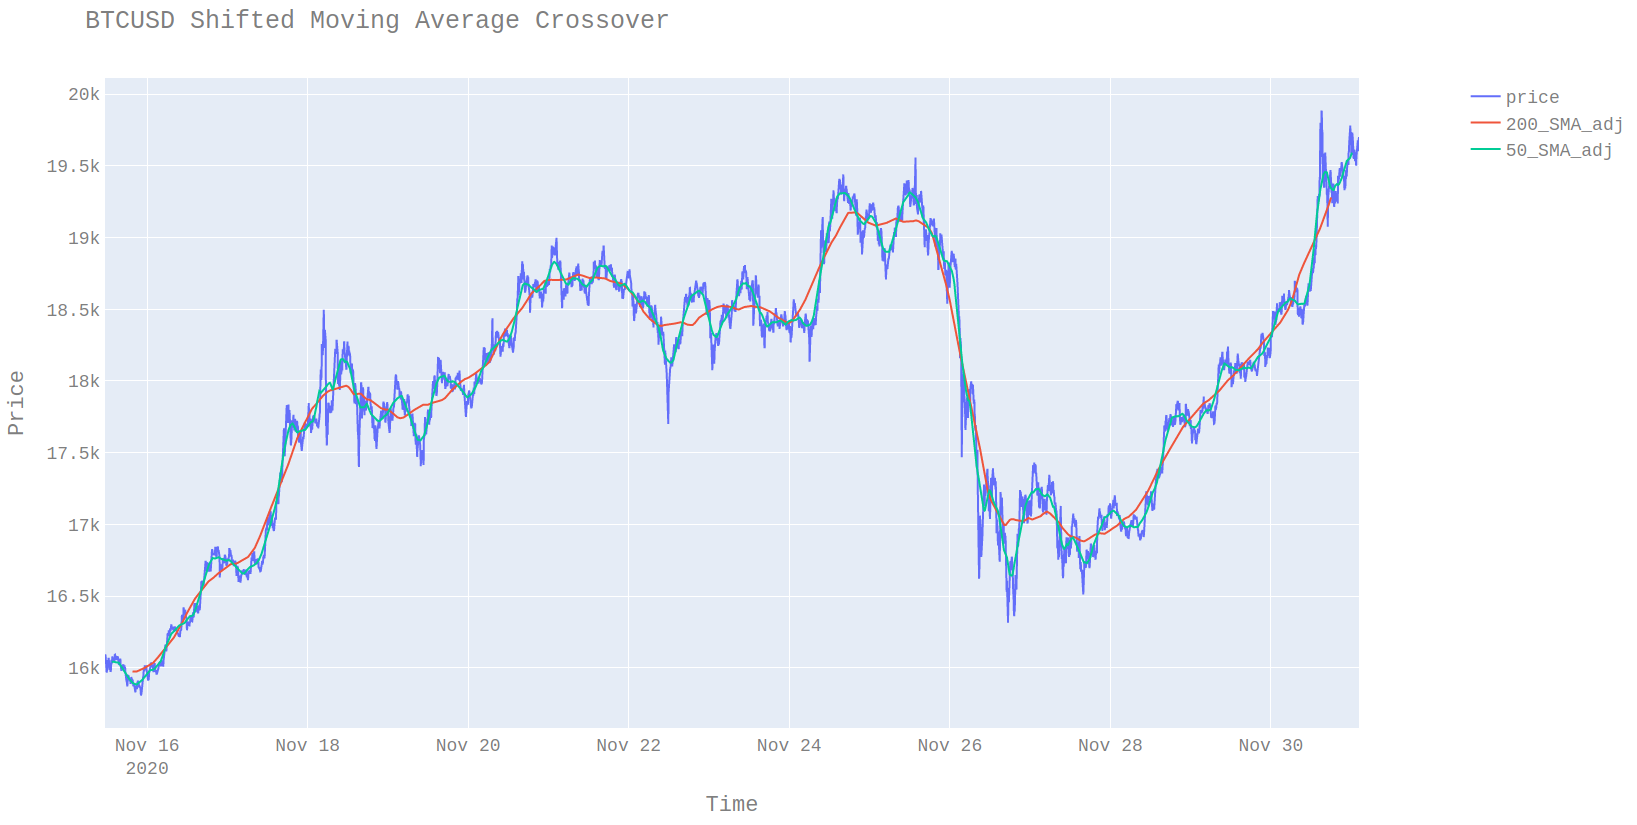
When the moving averages are phase-corrected (i.e. shifted) the mean reversion of the different moving averages can be more easily seen. The main issue is that due to the lag we do not know the current value of the indicator. This is a job for a forecasting model, but the lag gives us the amount time ahead the model it needs to fill in.
Trading
So is it possible to trade a moving average? Given the price reverts to the moving average would it be possible to place that bet? Yes and this is why it is useful to know about the link between moving averages and FIR filters. Let’s say we have a forecast for the SMA(4) in 4 steps time and it is above the current price. To trade this mean reversion it would be as simple as buying 4 contracts at the current price and then sell 1 contract per time step for the next 4 time steps. This strategy would have the payoff equivalent to
\[pnl = SMA(4)_{t+4} - price_t\]There is an explicit relationship between moving averages of different window length. This knowledge is useful when trying to implement a trading strategy since we are trading the future moving average vs the price rather than the current phase-corrected version.