Savitzky Golay Swing Points
Swing points are localised high or low prices in a time series. Swing point can be used to estimate optimal stop loss or take profit orders since they often become support/resistance at a later point in time. Collections of swing points can be used to identify technical patterns such as ranges, triangles, flags etc. They can also be used for identifying trends and return distributions. Having an automated technique to identify swing points reliably is quite a useful goal.
Swing Filter
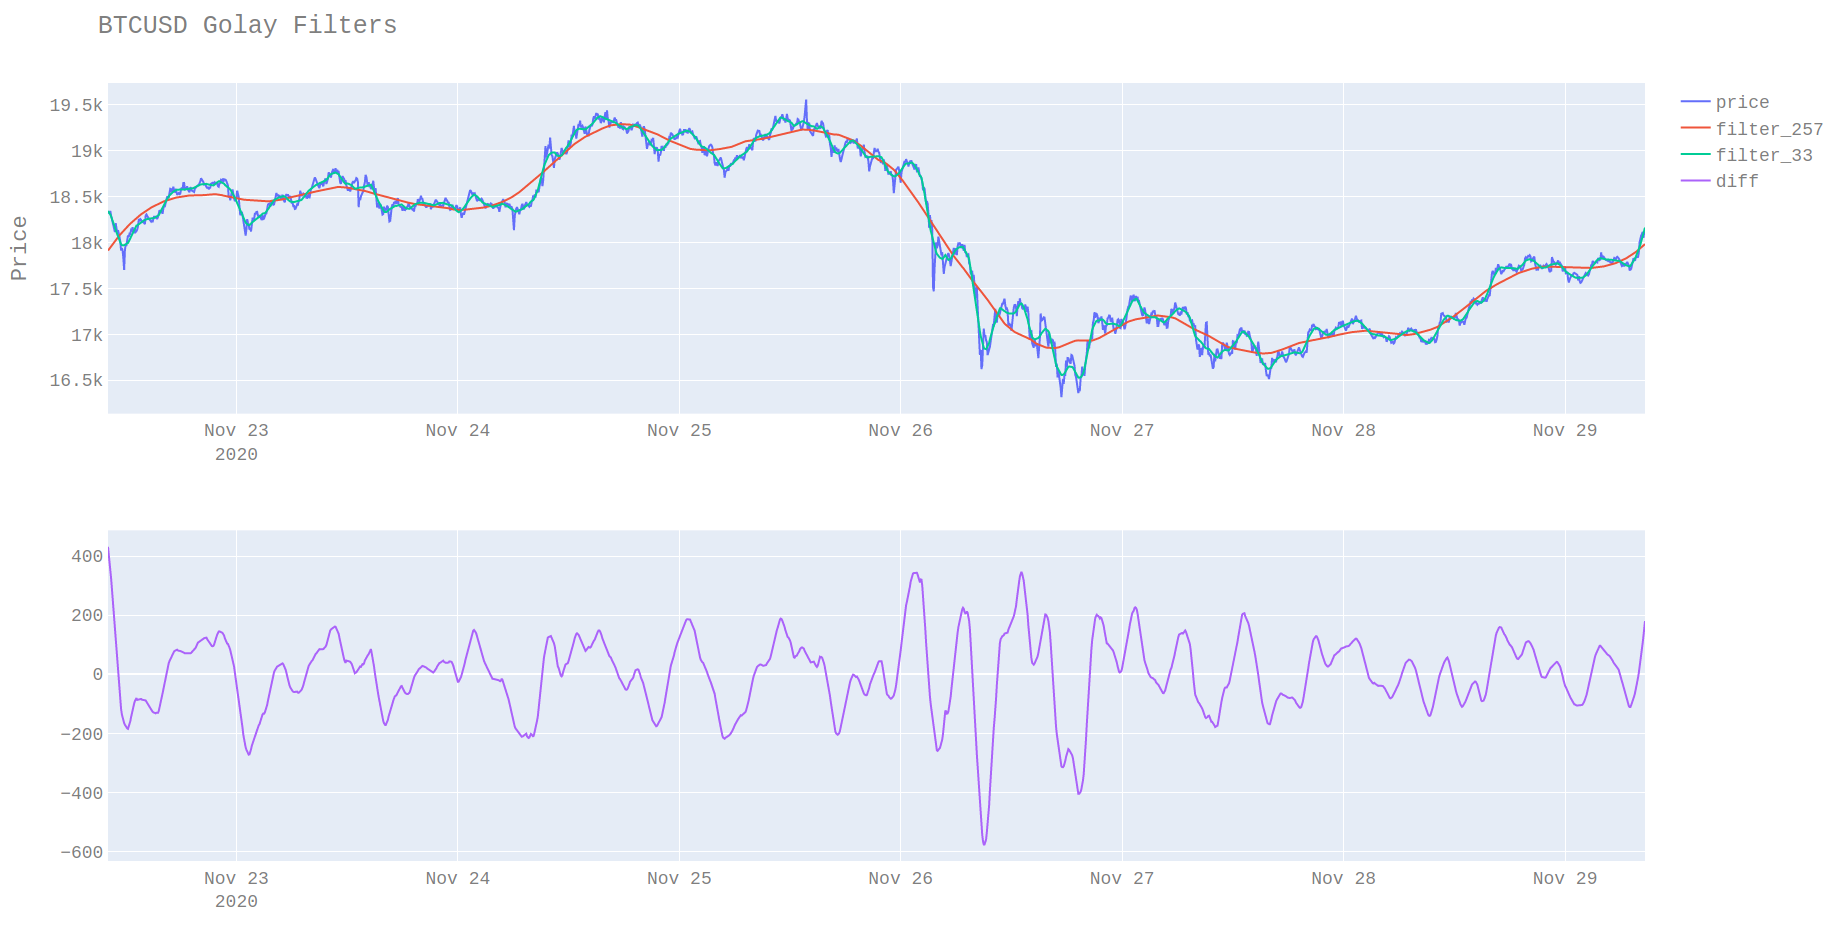
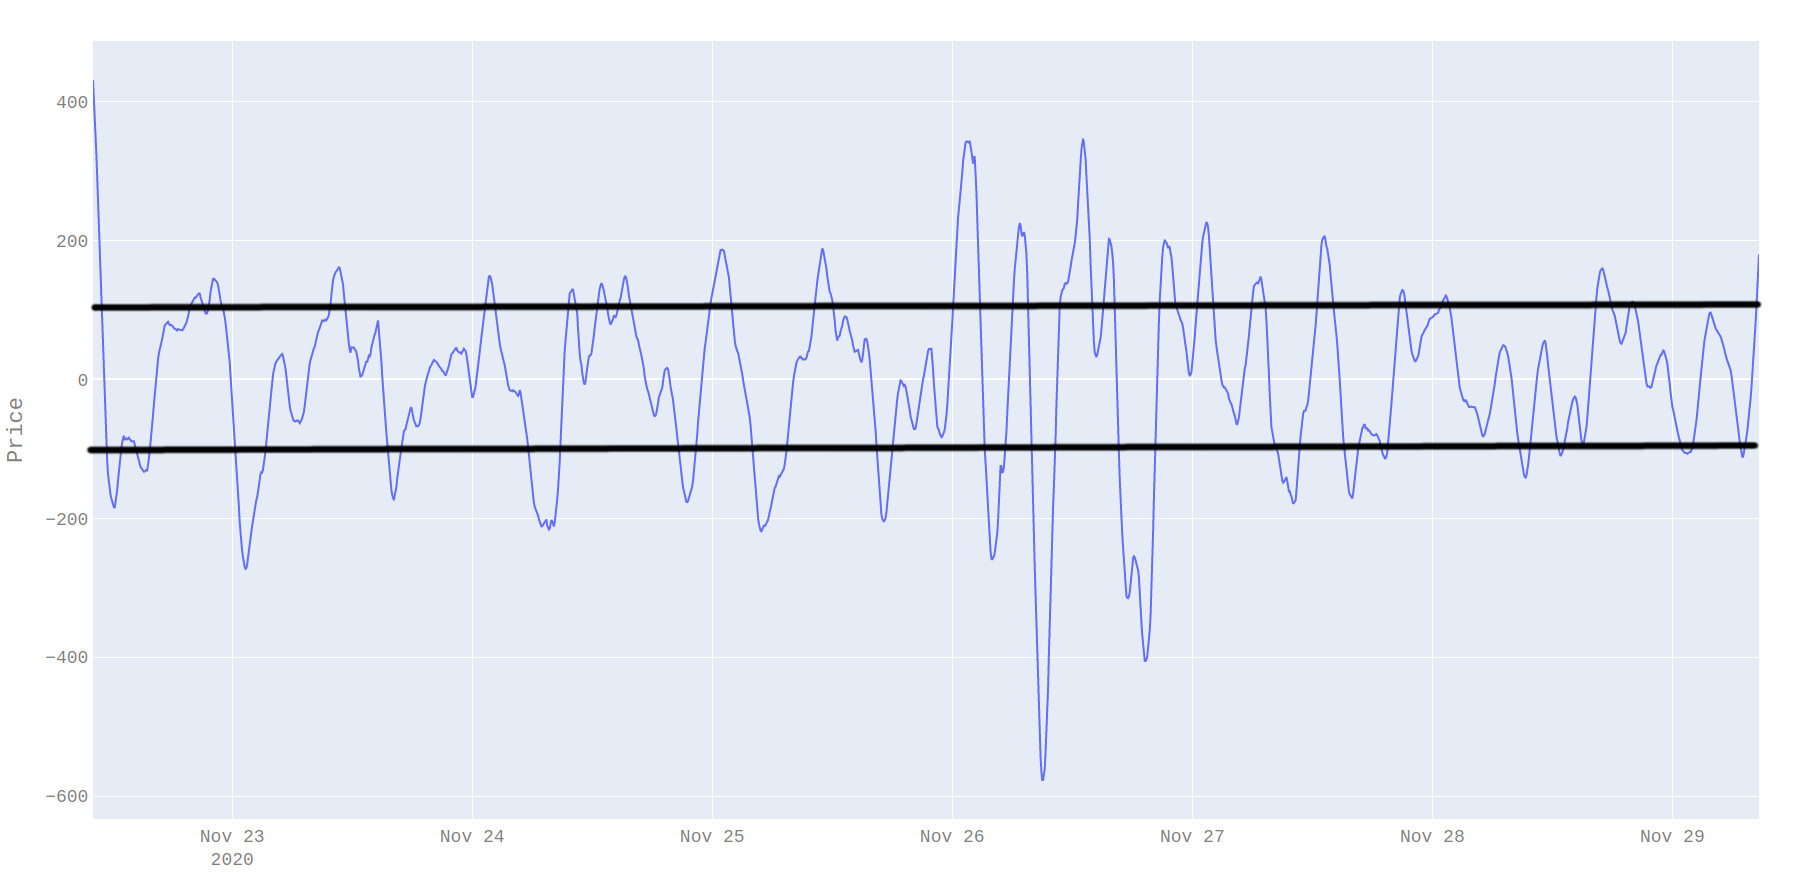
One useful property of savitsky-golay filter is that it fits closely to the data without needing to be phase-corrected. The results of this are that they can be used to identify swing points. If we look at the raw charts of prices with multiple levels of smoothing its possible to see that the difference of smoothed values with different window lengths is pretty stationary.

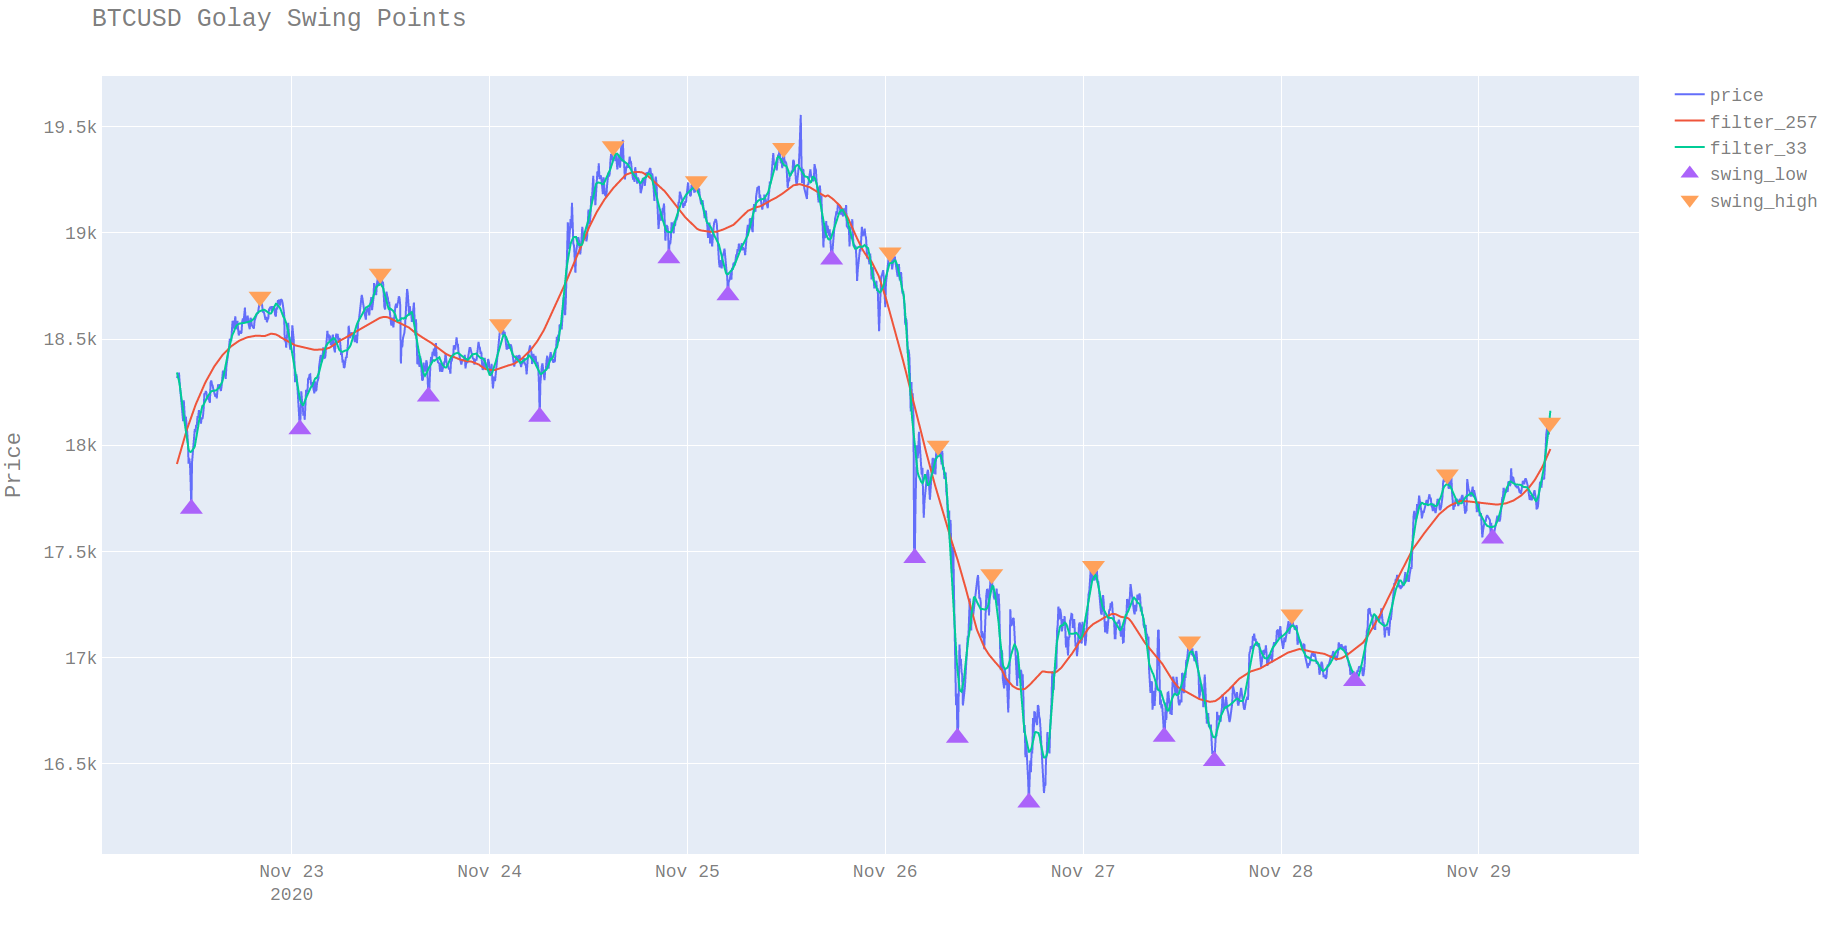
By adding a threshold for the differences in the two smoothed values it is possible to identify peaks. These peaks in the difference between smoothed values correspond to swing points. It’s possible to see that in some cases the threshold is crossed multiple times and in these cases, I opt to output the point with the highest deviation.

The result of this analysis is that the swing points can be determined offline. It is also possible to represent the swing point as the distribution of the ticks that are over the thresholds rather than a single point. The mean of these swing distributions can be used as a more reliable exit point since this is where most trading took place when the price changed direction and it thus where most remaining unfilled limit order trades are left.

Issues
Because zero lag filters change their estimates for recent values any recent swing points should be treated with caution due to the fact the smoothed values will change. The issue with zero lag filters is discussed here in more detail here. Even taking all this into account swing points are however useful for identifying past regimes.
Distribution Analysis
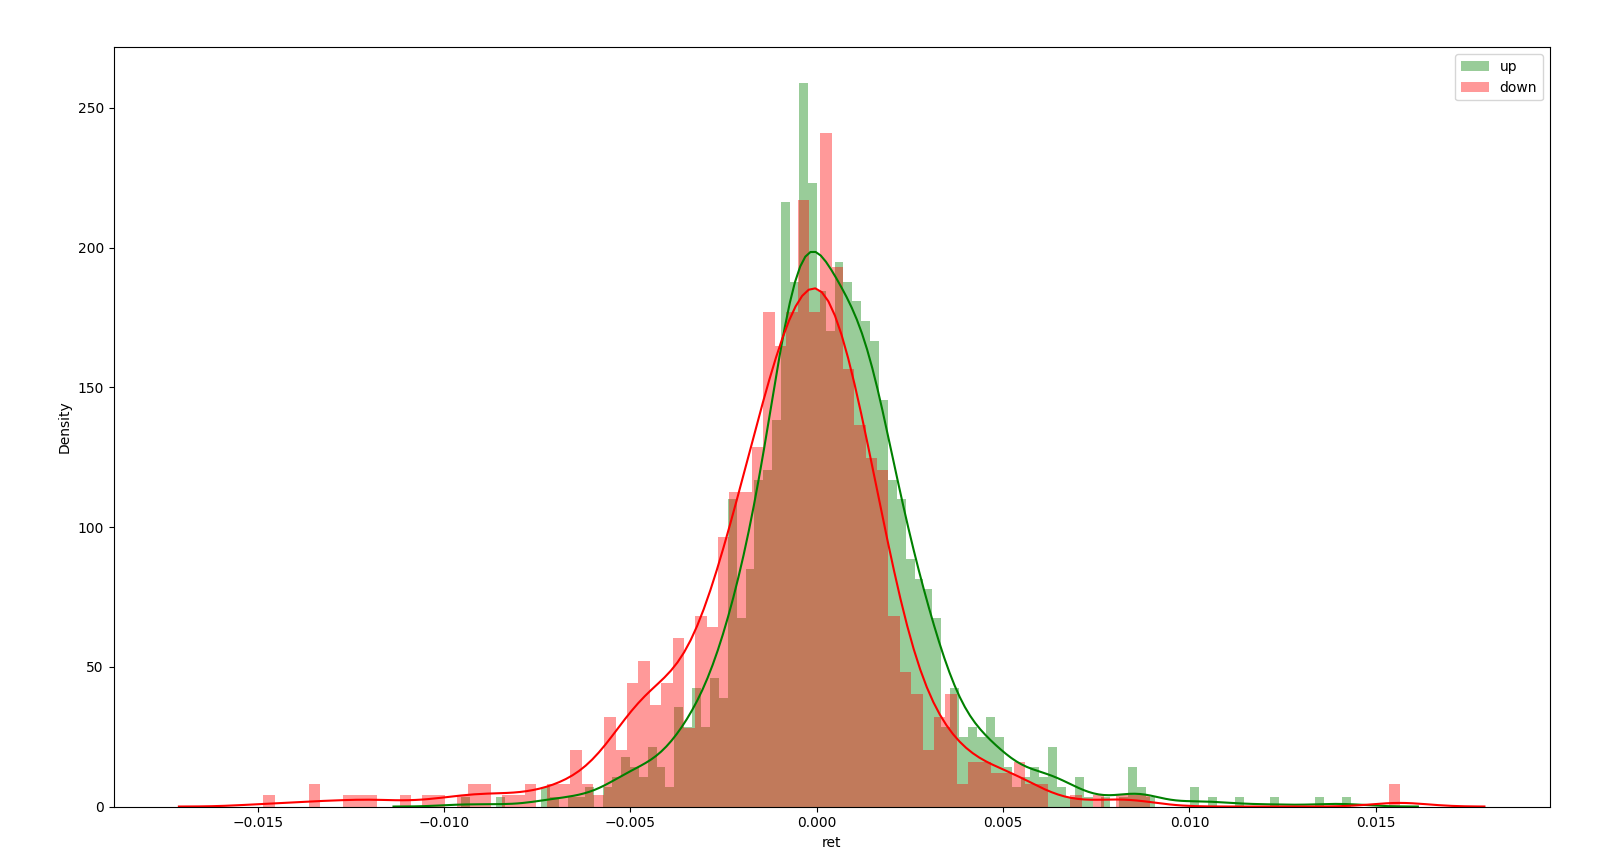
If we categorise the returns in to post a swing high or post swing low we can split the data into down legs and up legs respectively. If we look at the return distributions in these two market states we can see a clear distinction.

from scipy import stats
print(stats.skewnorm.fit(down_dist))
print(stats.skewnorm.fit(up_dist))

(1.4658222894017205, -0.0016728646504871707, 0.0032637137213598483)
(-0.97297328513577, 0.00145681876112843, 0.003516953005318996)
It can be seen in an up leg there is a positive skew and vice versa in a down leg. This information alone is not that useful since if you don’t know the current market state then its impossible to know what is likely to happen. It would be interesting to use the information about these unconditional distributions to test what the likely state of the market is.
\[Pr(state | return)\]I have not looked at predicting market state given returns but this would be a promising follow up analysis.