Slippage Analysis - Part 2
It turns out I was wrong about there being no slippage between paper and live. There is slippage, and it is pretty bad! There was a bug related to multithreading that was fixed and now after analysing the new data the multi-threading issue was masking the fills with bad slippage. The good thing is that the orders with slippage are few (10%), the bad thing is quite how significant the slippage is in some cases. The execution strategy is designed to be simple and tracks the respective touch price until its filled. In some cases, the market moves over 60 ticks without a fill in the other direction. To put it into context the tick to trade for my platform is < 1ms so something odd is going on.
Results
| Environment | Buy Count | Buy Qty | Avg Sell Price | Sell Count | Sell Qty | Avg Buy Price |
|---|---|---|---|---|---|---|
| Sim | 33 | 4328 | $18335.25 | 25 | 3478 | $18418.09 |
| Live | 33 | 4328 | $18339.92 | 25 | 3478 | $18414.61 |
| $ -4.67 | $-3.48 |
Volume weighted slippage was -$8.15 which is about -0.043%. The good news is that the strategy should still be profitable, however, it looks like about half the pnl is currently being lost of slippage. Ultimately there are solutions to this by using longer holding times but it is worth seeing if anything can be done about the slippage first.
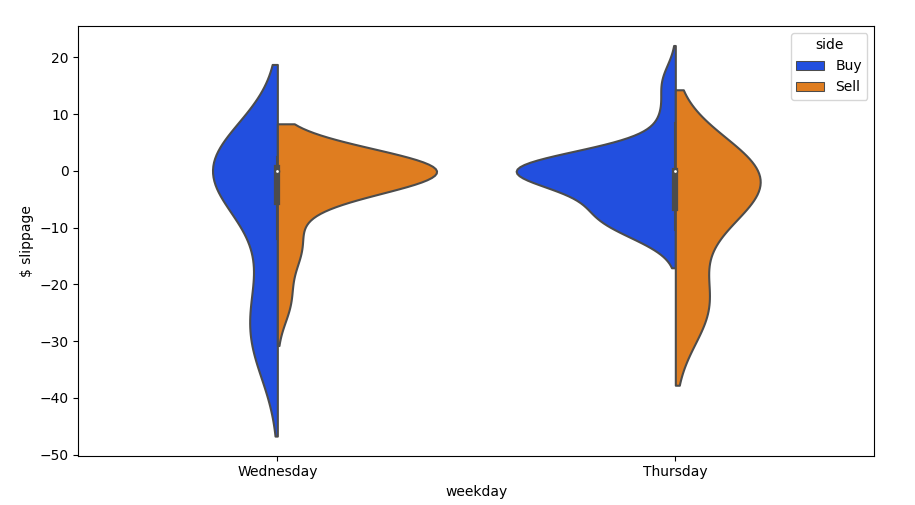
What is interesting to me is that in some cases even though we are running a simple strategy to track the touch price, the market is moving against us by 50-60 ticks 30-40 USD before we are filled. My experience of similar style strategies in CME/EUREX should very rarely cost more than 2-3 ticks. We are a long way from Kansas so likely will require different solutions.
I am writing this as I do the analysis so do not currently know the reason for the slippage being so high. This post is presented as an investigation rather than just showing a solution (to which I’m not even sure there is one). I feel this will be more useful and hopefully more interesting to read.
Topics of Investigation
- Latency
- I am testing the model from home in Europe the one-way latency is about 250ms. My internet connection is also rubbish, so I would not be surprised if this is part of the problem.
- Market Conditions
- What are the market conditions when large slippage occurs?
- Better execution models
- Given the market goes on a walk sometimes is it better to use some other strategy to set exit levels?
A simple solution might seem to be using market orders. The issue in crypto exchanges is the fees rather than the spreads. The BTCUSD spread is normally about 0.27-0.5bps (0.5-1 USD) The BYBIT fees however are -25 bps as a maker and +75 bps as a taker. So at current prices that is the difference between being paid 5 USD and paying 15 USD. So the slippage either needs to be very bad or the model to decide on whether using market orders vs. limit orders needs to be accurate enough to overcome a 20 USD difference in price.
Fixing latency
Latency is the easiest thing to fix but where are BYBITs servers? You would think they are in Singapore given that is where the company is based. However, by resolving the streaming api url to an ip address and then using a tool to ping the machine from different locations we can see where the gateway is. For HFT you want to know which building it is in but at the moment I currently have a 250ms latency so I would be happy with a 10x reduction.
I rented a server near that location and tested the latency.
> ping 184.26.53.187
64 bytes from 184.26.53.187: icmp_seq=1 ttl=241 time=7.29 ms
64 bytes from 184.26.53.187: icmp_seq=2 ttl=241 time=7.18 ms
64 bytes from 184.26.53.187: icmp_seq=3 ttl=241 time=7.19 ms
64 bytes from 184.26.53.187: icmp_seq=4 ttl=241 time=7.34 ms
This is good enough, and a large improvement over previous tests. The strategy now has a ping around 7 ms to the gateway, so I will see if this has any effect on the slippage over the next few days.
update
From running live on the new machine the REST api latencies are quite different from what the ping would suggest. It would see the matching engine is not anywhere where the api gateway ip would suggest. Either that or their gateway latency is not very good. Either way, practical latencies for inserts and cancels are about 80ms vs 250ms.
Market Conditions
So what happens when we have a lot of slippage. I think part of the clue was that the threading issue masked the slippage. I can only assume that by looking at individual fills with high slippage that the limit order book (LOB) will tell us what is going on.
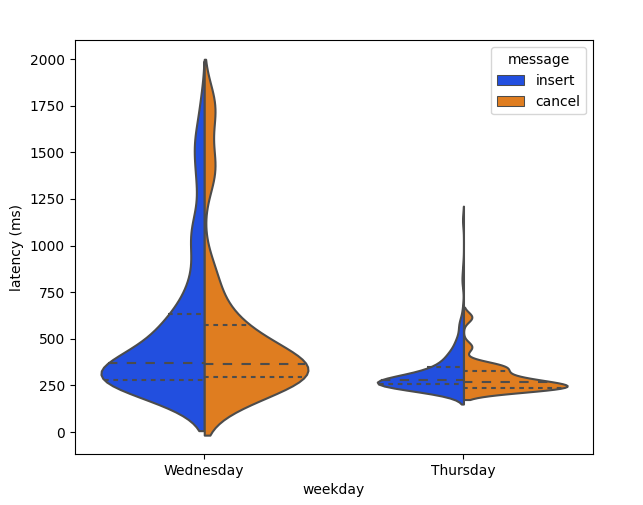
The message latency for inserting and canceling orders from the LOB is multi-modal and has long tails. Mean latency was around 250 ms however regally it takes over 1,500 ms to get a response from the exchange. This is another reason simulating crypto exchanges is difficult since the latency distribution has such long tails.
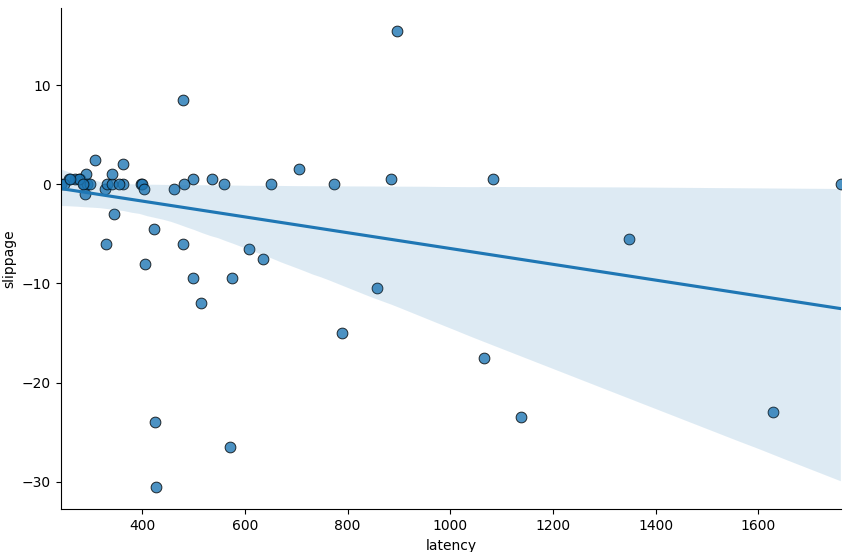
I would expect a strong correlation between latencies and slippage. There seems to be a slight relationship but it does not look like it is nearly good enough to justify sending market orders.
Next Steps
All of this analysis took a lot longer than expected. There is still a lot more to namely
- Look more at market conditions and flow toxicity around times of high slippage.
- Build plots of the LOB around times when there was high slippage.
- Investigate different execution strategies that are less noise-sensitive.
I will have to pick up these takes at a later date.